This blog post presents the concept of behavioural interventions and how these interventions can be applied in the domain of demand-side energy management. It tries to explain in a simple manner why nudges are important for decision-making and presents a tutorial for creating energy-related electronic home energy reports.
The post is organized as follows:
- Introduction to informational nudges for energy management
- Prerequisites
- Data management
- HER generation
- Conclusion
1. Introduction to informational nudges for energy management
Behavioural interventions, such as informational nudges, have become an increasingly popular strategy in demand-side energy management. In particular, home energy reports (HERs) have been used to induce behavioural change among residential consumers. Through the Energy Efficiency Directive, European Union proposes several recommendations for EU countries and energy companies regarding implementing the new metering and billing provisions to provide clear information to consumers.
However, since this blog post is a technical tutorial about creating home energy reports using the python programing language, the reader can refer to the EVIDENT project deliverable list here and the Energy Efficiency Directive here.
2. Prerequisites
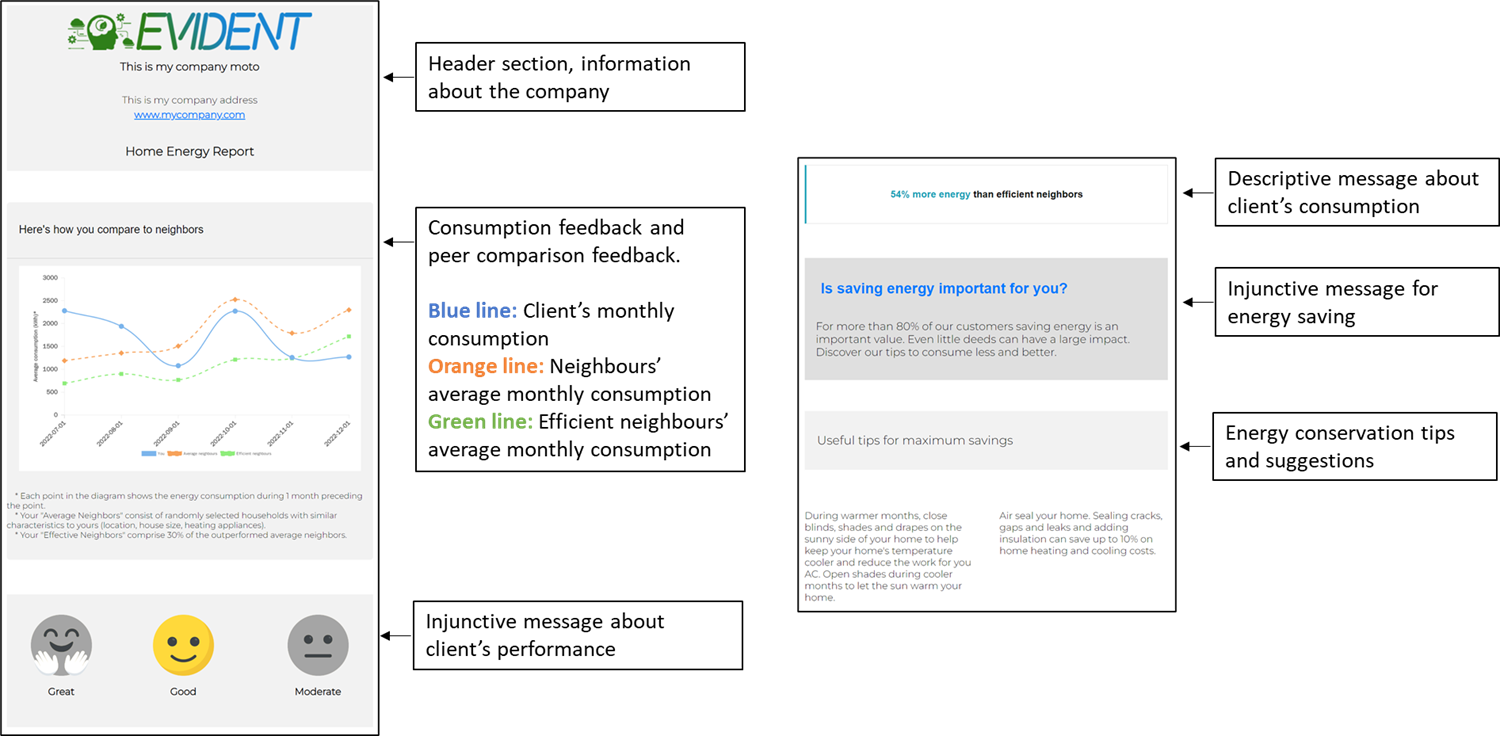
For the needs of the following tutorial, we will assume that an energy company plans to send a monthly home energy report to its clients to inform them about their consumption, provide a comparison with similar neighbours (peer comparison), communicate conversation tips and raise awareness about energy waste. The home energy report template we are using is explained in Figure 1.
We assume that the energy company uses energy meters to collect the consumption of their clients, and the data provided are aggregated to monthly totals. In addition, the energy company provides a list of demographic data about their customers and their houses. The data contains the region the clients’ houses are located, the size in square meters of each house and the heating appliances used by the household for heating. Heating appliance is a factor that may change the energy consumption of the household drastically in the case it uses electricity. Often households with electricity-based heating appliances present a different consumption pattern than those with alternative appliances (e.g. fireplace). To make our scenario easier to interpret, we will assume that there are no missing data and the household uses only one heating appliance.
Our scope is to analyse the given data, cluster the clients into neighbourhoods to provide comparison and finally generate the electronic home energy report to be delivered through email. For our scenario, the neighbourhoods remain constant, even if conditions might change over time. For example, a household may proceed to house upgrades and change the heating appliances. Our home energy report will illustrate data for six months. The data that will be used are randomly generated and are described in the following two tables.
| Field | Description | Example |
|---|---|---|
| client_id | 5-digits unique ID for each client | 97e31 |
| date | Month and year of the consumption | 01-2022 |
| consumption | Monthly energy consumption in Wh | 2.490.327 |
| Field | Description | Example |
|---|---|---|
| client_id | 5-digits unique ID for each client | 97e31 |
| region | Month and year of the consumption | “Region A” |
| size | Monthly energy consumption in Wh | 150 |
| heating_appliance | The heating appliance used for heating | “Air condition” (uses electricity) |
To properly create the client neighbourhoods, we must make some decisions and take them for granted. These decisions could have relied on the available data, but since they are synthetic, we will decide them in advance. First, we suggest that different regions may have different weather conditions; thus, comparing clients from different regions is pointless. Second, we should somehow group clients with similar house sizes. If we select not to create some house sizes classes, we might create a unique neighbourhood for each client. Third, the heating appliance tells a lot about energy consumption, but we can’t manage this information per se. Thus, we are creating two additional features described in the table below.
| Field | Description | Example |
|---|---|---|
| size_class | The class of the size the house belongs. We assume three classes “small”, “medium”, and “large”. * |
“large” |
| heating_appliance_class | Whether the heating appliance operates on electricity, we use two possible values, “electricity-based” and “no-electricity-based”. |
“electricity-based” |
* Every house less than 60 square meters will be considered small. Houses between 60 and 120 square meters will be considered medium, and houses larger than 120 square meters will be considered large.
The final dataset we are using in this analysis can be found here. To simplify our scenario, the document contains data for ten consumers. The data presents their monthly total consumption for a 12 months period while no data is missing. Six of the houses belong to the “medium” class, while the rest are characterized as “small”. Regarding the use of electricity, we suggest that 50 per cent of the houses use a heating appliance that operates on electricity, while the rest don’t
3. Data management
The following section’s scope is to analyse the available data and create the clients’ neighbourhoods. We are working with python and using JupyterLab to make our lives easier. So, let’s get started by importing the needed libraries and initialising some parameters.
Import libraries
import re
import math
import random
import codecs
import datetime as dt

import pandas as pd
pd.set_option('display.float_format', lambda x: '%.3f' % x)
pd.set_option('display.max_rows', 5)
Input parameters
data = "consumption_data_and_demographics.xlsx" #  consumption data and demographics
her_template_filename = "her_template.html" #  home energy report template

image_with_bg_great = "http://evident-h2020.eu/wp-content/uploads/2023/01/happy_color.png"
image_with_no_bg_great = "http://evident-h2020.eu/wp-content/uploads/2023/01/happy_no_color.png"
image_with_bg_good = "http://evident-h2020.eu/wp-content/uploads/2023/01/good_color.png"
image_with_no_bg_good = "http://evident-h2020.eu/wp-content/uploads/2023/01/good_no_color.png"
image_with_bg_moderate = "http://evident-h2020.eu/wp-content/uploads/2023/01/sad_color.png"
image_with_no_bg_moderate = "http://evident-h2020.eu/wp-content/uploads/2023/01/sad_no_color.png"

green = "#28a745"
blue = "#17a2b8"
red = "#dc3545"

#  energy conservation tips
energy_consumption_tips = [
"Air seal your home. Sealing cracks, gaps and leaks and adding insulation can save up to 10% on home heating and cooling costs.",
"Clean or replace all filters in your home regularly. Dirty filters make your system work harder and run longer than necessary.",
"During warmer months, close blinds, shades and drapes on the sunny side of your home to help keep your home's temperature cooler and reduce the work for you AC. Open shades during cooler months to let the sun warm your home.",
"Don't peek in the oven while baking! Every time you peek, the temperature can drop 25 F, making your oven use more energy to bring the temperature back up.",
"Don't leave your electronics on all day long. Only turn on your computer, monitor, printer and fax machine when you need them."
]
While most of the parameters are self-explanatory, other needs some justifications. For example, the second line indicates the home energy report template file. The template file can be found here.
Within our home energy report, we will create an injunctive feedback section providing information about the client’s performance with emojis (see figure 1). These figures should be hosted on a web server to be available anytime the client opens the report file. For our case, we are using the EVIDENT project webserver to host the figures. In total, there are three pairs of figures for the client’s performance (great, good, moderate), while only one status can be active in each case. Here is an example of a client with good performance. The rest figures are “disabled”.

In addition, we declare some additional parameters for the colouring and the energy conservation tips we will include in our home energy report.
Read data
df_consumptions = pd.read_excel(open(data, 'rb'), sheet_name='Consumptions')
df_demographics = pd.read_excel(open(data, 'rb'), sheet_name='Demographics')
df = pd.merge(df_consumptions, df_demographics, on ='client_id', how ='inner') # merge the two dataframes

df['consumption'] = df['consumption']/1000 #  convert consumption to kWh instead of WattHours

#  keep only the relative months - let's suppose that we are sending the home energy report on January 2023,
#  thus we will include only data from July to Dec, 2022
df = df.loc[df.date >= dt.datetime.strptime('2022-07-01', '%Y-%m-%d')].reset_index(drop=True)

display(df)
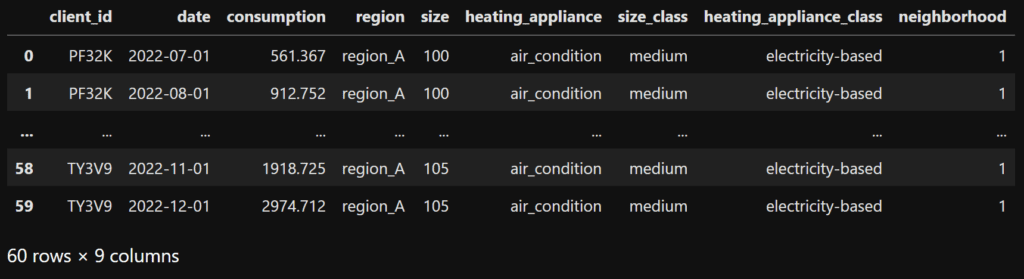
This section opens the file containing our data and merges the two excel sheets. We also convert the consumption into kWh and keep only the data we want to include in the home energy report (July – December 2022). Figure 3 presents the remaining data.

Create neighbourhoods based on clients’ characteristics
Let’s proceed to the neighbourhood creation based on the region of the house, the house size class and whether the heating appliance operates on electricity.
# create a new column with a unique id for each neighborhood
df['neighborhood'] = df.groupby(['region', 'size_class', 'heating_appliance_class'], sort=False).ngroup() + 1
display(df)
Based on the available data, four neighbourhoods were created. Table 4 presents the four neighbourhoods along with their characteristics and their neighbours.
| Neighbourhood | Region | Size class | Heating appliance class | Neighbours’ ids |
|---|---|---|---|---|
| #1 | Region A | small | no-electricity-based | AzIYx, ECVCe |
| #2 | Region A | small | electricity-based | XcbkW, dLcgm |
| #3 | Region A | medium | electricity-based | PF32K, cRD6M, TY3V9 |
| #4 | Region A | medium | no-electricity-based | FSXdB, mhbQY, RtBVF |
Since the neighbours have been defined, we are ready to calculate the consumptions and prepare the data to generate our home energy reports.
Calculate the consumptions for each client
def calculate(row):

    clients_df = df.loc[ #  this df will temporary store all client's neighbours
        (df['neighborhood'] == row["neighborhood"]) & #  get the clients from the same enighborhood
        (df['date'] == row["date"]) & #  get only records with the same date
        (df['client_id'] != row["client_id"])] #  exclude the current user

    #  calculate the number of efficient neighbours as the 30% of the most efficient clients
    efficient_clients = round(len(clients_df) * 0.3)

    #  calculate the average consumption of the neighbours
    clients_mean = clients_df['consumption'].mean()

    #  calculate the average consumption of the efficient neighbours
    efficient_clients_mean = clients_df.sort_values(by=['consumption']).head(efficient_clients)['consumption'].mean()

    #  return a pandas series to append it to the results dataframe
    return pd.Series(
        [row["client_id"], row["date"], clients_df['client_id'].to_list(), len(clients_df['client_id'].to_list()),
        efficient_clients, row["consumption"], clients_mean, efficient_clients_mean],
        index=['client_id', 'date', 'neighboor_list', 'neighboors', 'efficient_neighboors', 'client_consumption',
        'neighboors_mean_consumption', 'efficient_neighboors_mean_consumption']
    )


results = pd.DataFrame() #  create a dataframe to store the results
results = results.append(df.apply(lambda row : calculate(row), axis = 1))
results = results.sort_values(by=['client_id', 'date'])
display(results)
First things first. In this section, we execute a function for every row in our data frame. This happens at the bottom of the section. We execute the “calculate” function and append the results to a new data frame named “results”. The function does the following:
- Stores a temporary data frame with all the neighbours’ data of the selected client and the selected month.
- It calculates the number of efficient neighbours as 30% of the average neighbours.
- It calculates the mean consumption for the neighbours.
- It calculates the mean consumption for the efficient neighbours.
- Returns a new pandas series to be appended in the “results” data frame.
The section has been heavily commented on to help the reader understand the process. The results of this section are presented in Figure 5.
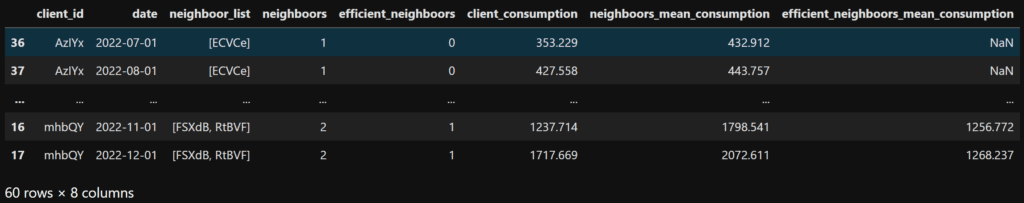
As we can see, the results contain eight columns that will be used to generate the home energy report. Let’s explain some of them. The columns neighbours and neighbour_list present the number of neighbours and a list with neighbours’ ids. The column efficient_neighbours presents the number of efficient neighbours. The column client_consumption presents the client’s consumption for the selected month, while the columns neighbours_mean_consuption and efficient_neighbours_mean_consuption present the average consumption for the average and efficient neighbours, respectively.
Since our dataset is rather small, we observe a NaN in the efficient_neighbours_mean_consuption column for the neighbourhoods with two clients. This won’t be a problem since, in a real scenario, our data will contain more than ten clients and, thus, larger neighbourhoods.
4. Home Energy Reports Generation
Finally, let’s generate our home energy reports.
def generate(client):

    her_template = codecs.open(her_template_filename, 'r', encoding="utf8").read() #  load the HER template
    # get all client's records and sort them by date
    client_results_df = results.loc[(df['client_id'] == client)].sort_values(by=['date'])

    #  find the number of efficient neighbours
    no_of_efficient_neighboors = client_results_df.iloc[-1]["efficient_neighboors"]

    #  calculate the mean consumption for the client for the whole 6months period
    client_mean_consumption = client_results_df["client_consumption"].mean()

    #  calculate the mean consumption for the average neighbours for the whole 6months period
    average_neighboors_mean_consumption = client_results_df["neighboors_mean_consumption"].mean()

    #  calculate the mean consumption for the efficient neighbours for the whole 6months period
    efficient_neighboors_mean_consumption = client_results_df["efficient_neighboors_mean_consumption"].mean()

    # if there are no efficient neighbours - this might happens when neighbourhoods are very small
    if no_of_efficient_neighboors == 0:
        efficient_neighboors_mean_consumption = client_mean_consumption
        #  delete the percentange section
        her_template = re.sub("<!--percentange-->[\s\S]*<\/tr><!--\/percentange-->", "" , her_template)

    #  Descriptive and injunctive feedback section
    if client_mean_consumption < efficient_neighboors_mean_consumption: #  greate performance
        her_template = her_template.replace("[great_image]", image_with_bg_great)
        her_template = her_template.replace("[callout_color]", green)
        her_template = her_template.replace("[callout_text]", str(int(math.ceil((1.0 -
                       (client_mean_consumption/efficient_neighboors_mean_consumption))*100))) + "% less")

    elif efficient_neighboors_mean_consumption < client_mean_consumption and client_mean_consumption <
        average_neighboors_mean_consumption: #  good performance

        her_template = her_template.replace("[good_image]", image_with_bg_good)
        her_template = her_template.replace("[callout_color]", blue)
        her_template = her_template.replace("[callout_text]", str(int((client_mean_consumption/
                       efficient_neighboors_mean_consumption)*100 - 100)) + "% more")

    else: #  moderate performance
        her_template = her_template.replace("[moderate_image]", image_with_bg_moderate)
        her_template = her_template.replace("[callout_color]", red)
        her_template = her_template.replace("[callout_text]", str(int((client_mean_consumption/
                       efficient_neighboors_mean_consumption)*100 - 100)) + "% more")

    # replace the rest images with the non-color version
    her_template = her_template.replace("[great_image]", image_with_no_bg_great)
    her_template = her_template.replace("[good_image]", image_with_no_bg_good)
    her_template = her_template.replace("[moderate_image]", image_with_no_bg_moderate)

    #  energy consumption feedback and peer comparison section
    consumer_historic_months = ','.join(client_results_df['date'].dt.date.astype(str).to_list())
    consumer_historic_values = ','.join(client_results_df['client_consumption'].astype(str).to_list())
    consumer_historic_values_neighbours = ','.join(client_results_df['neighboors_mean_consumption'].astype(str).to_list())
    consumer_historic_values_efficient_neighbours =
                                ','.join(client_results_df['efficient_neighboors_mean_consumption'].astype(str).to_list())

    her_template = her_template.replace("[[historic_period_months]]", str(consumer_historic_months))
    her_template = her_template.replace("[[historic_period_consumer_values]]", str(consumer_historic_values))
    her_template = her_template.replace("[[historic_period_consumer_values_neighbours]]", str(consumer_historic_values_neighbours))
    her_template = her_template.replace("[[historic_period_consumer_values_efficient_neighbours]]",
                   str(consumer_historic_values_efficient_neighbours))

    #  energy efficiency tips section
    tips_to_use = random.sample(energy_consumption_tips, 2)
    her_template = her_template.replace("[tip_1-text]", tips_to_use[0])
    her_template = her_template.replace("[tip_2-text]", tips_to_use[1])

    # saving .html file
    client_html_filename =  "data_raw/" + str(client) + ".html"
    client_html_file = open(client_html_filename, "w", encoding="utf8")
    client_html_file.write(her_template)
    client_html_file.close()


for client in results["client_id"].unique():
    generate(client)
Let’s examine the generation section above. This section will execute the “generate” function once for each client. This happens at the bottom of the section. Let’s see what the “generate” function does.
For each client:
- It copies the home energy report template so to start making the adjustments
- Gets a copy of the client’s results.
- Calculates the mean consumption for the client, the average and efficient neighbours, and fills in the injunctive and the descriptive feedback sections (emojis section and percentage from efficient neighbours).
- Prepares the data and fills in the diagram with the consumption feedback and the peer comparison feedback.
- Randomly selects and fills in two energy conservation tips from the initial list.
- Stores the home energy report template into an HTML file.
The home energy report template used in this section has been designed to include some placeholders. The placeholders are elements in the template that will be rewritten by the generate function to contain personalized information about the client. For example, the report template placeholder [tip_1-text] will be used to get replaced by the first energy conservation tip. Table 5 presents all placeholders within the home energy report template.
| Placeholder | Description |
|---|---|
| [[historic_period_months]] | Values for the X-axis of the consumption feedback diagram. e.g. 2022-07-01,2022-08-01,2022-09-01,2022-10-01,2022-11-01,2022-12-01 |
| [[historic_period_consumer_values]] | Blue series for the consumption feedback diagram (client’s consumption) e.g 1066,1121,1032,1654,1918,2974 |
| [[historic_period_consumer_values_neighbours]] | Orange series for the consumption feedback diagram (average clients’ consumption) e.g. 552,1175,1090,1301,2030,2396 |
| [[historic_period_consumer_values_efficient_neighbours]] | Green series for the consumption feedback diagram (efficient clients’ consumption) e.g. 544,912,950,1065,1912,1993 |
| [great_image] | Source for the great performance image |
| [good_image] | Source for the good performance image |
| [moderate_image] | Source for the moderate performance image |
| [callout_color] | Colour of the descriptive message box |
| [callout_text] | Text (percentage) of the descriptive message box |
| [tip_1-text] | First energy conservation tip |
| [tip_2-text] | Second energy conservation tip |
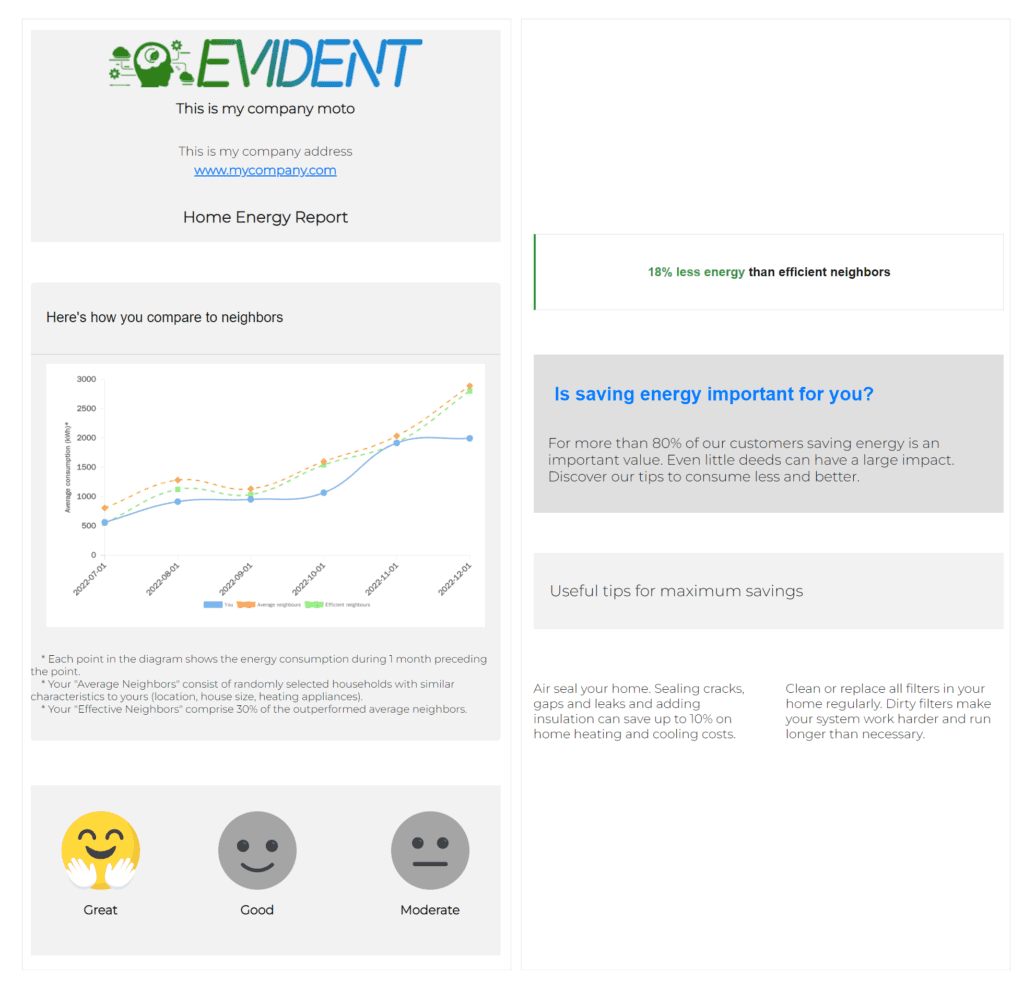
The above section will create ten home energy reports in your current directory. An example of the client with id “PF32K” is presented in figure 6.
5. Conclusion
This post presented a simple scenario about creating a home energy report with Python. At the same time, we provided the base code one should consider while preparing the reports. Of course, there are many more one should consider. For example, we take for granted that the data are valid since we created them. Before getting into the home energy report generation, a thorough descriptive analysis should be conducted since there might be missing data or extreme values that should be handled differently.
In addition, the home energy reports we generated were based on a simple template we prepared for the needs of this tutorial. We included only some information to keep things simple and comprehensible. A more advanced/complex report template could include information about the rank of each client within the neighbourhood or include personalized tips based on the client’s performance or demographics (we simply randomly select some tips). Additionally, an advanced home energy report could even include a disaggregation about how the electricity is shared among the client’s house appliances. however, all these ideas depend on the available data.
The Jupyter notebook used in this tutorial can be found here: https://github.com/KarypidisParis/HER_generation